Sniffing I²C traffic visually with i2cdriver
Problem statement
Recently I was forced to sniff a bunch of I²C traffic, and make sense of it. My ultra-fancy $8 chinese logic analyzer1 does a reasonable job… and PulseView isn’t terrible. But it leaves a lot to be desired.
In this post I detail a 10-minute hack that improved my quality of life (when it comes to I²C) immeasurably.
Background
As I said, I used to use logic analyzer for sniffing I²C, and that is fine.
You get waveforms:
 I²C capture – waveform
and per-category dumps (pictured is mashup of all “Data write” traffic):
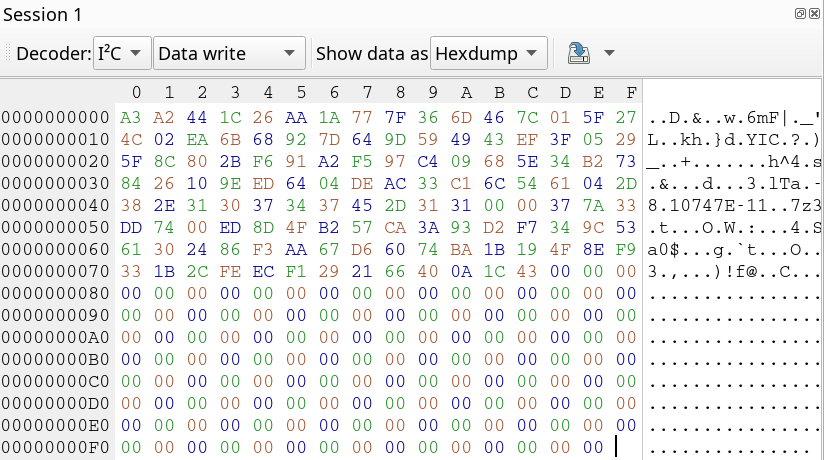 I²C capture – dump of all “Data write” traffic
but it’s still somewhat laborious to make sense of the exchanges, especially for longer communication dumps.
I wouldn’t trade logic analyzer for what follows in case of signal integrity and/or protocol integrity related issues. But if you assume that the protocol is well-formed, and all you want is make sense of the traffic… well, PulseView isn’t the best tool for the job2.
The following is (at least much better).
Solution
The first part of the solution is i2cdriver itself3:
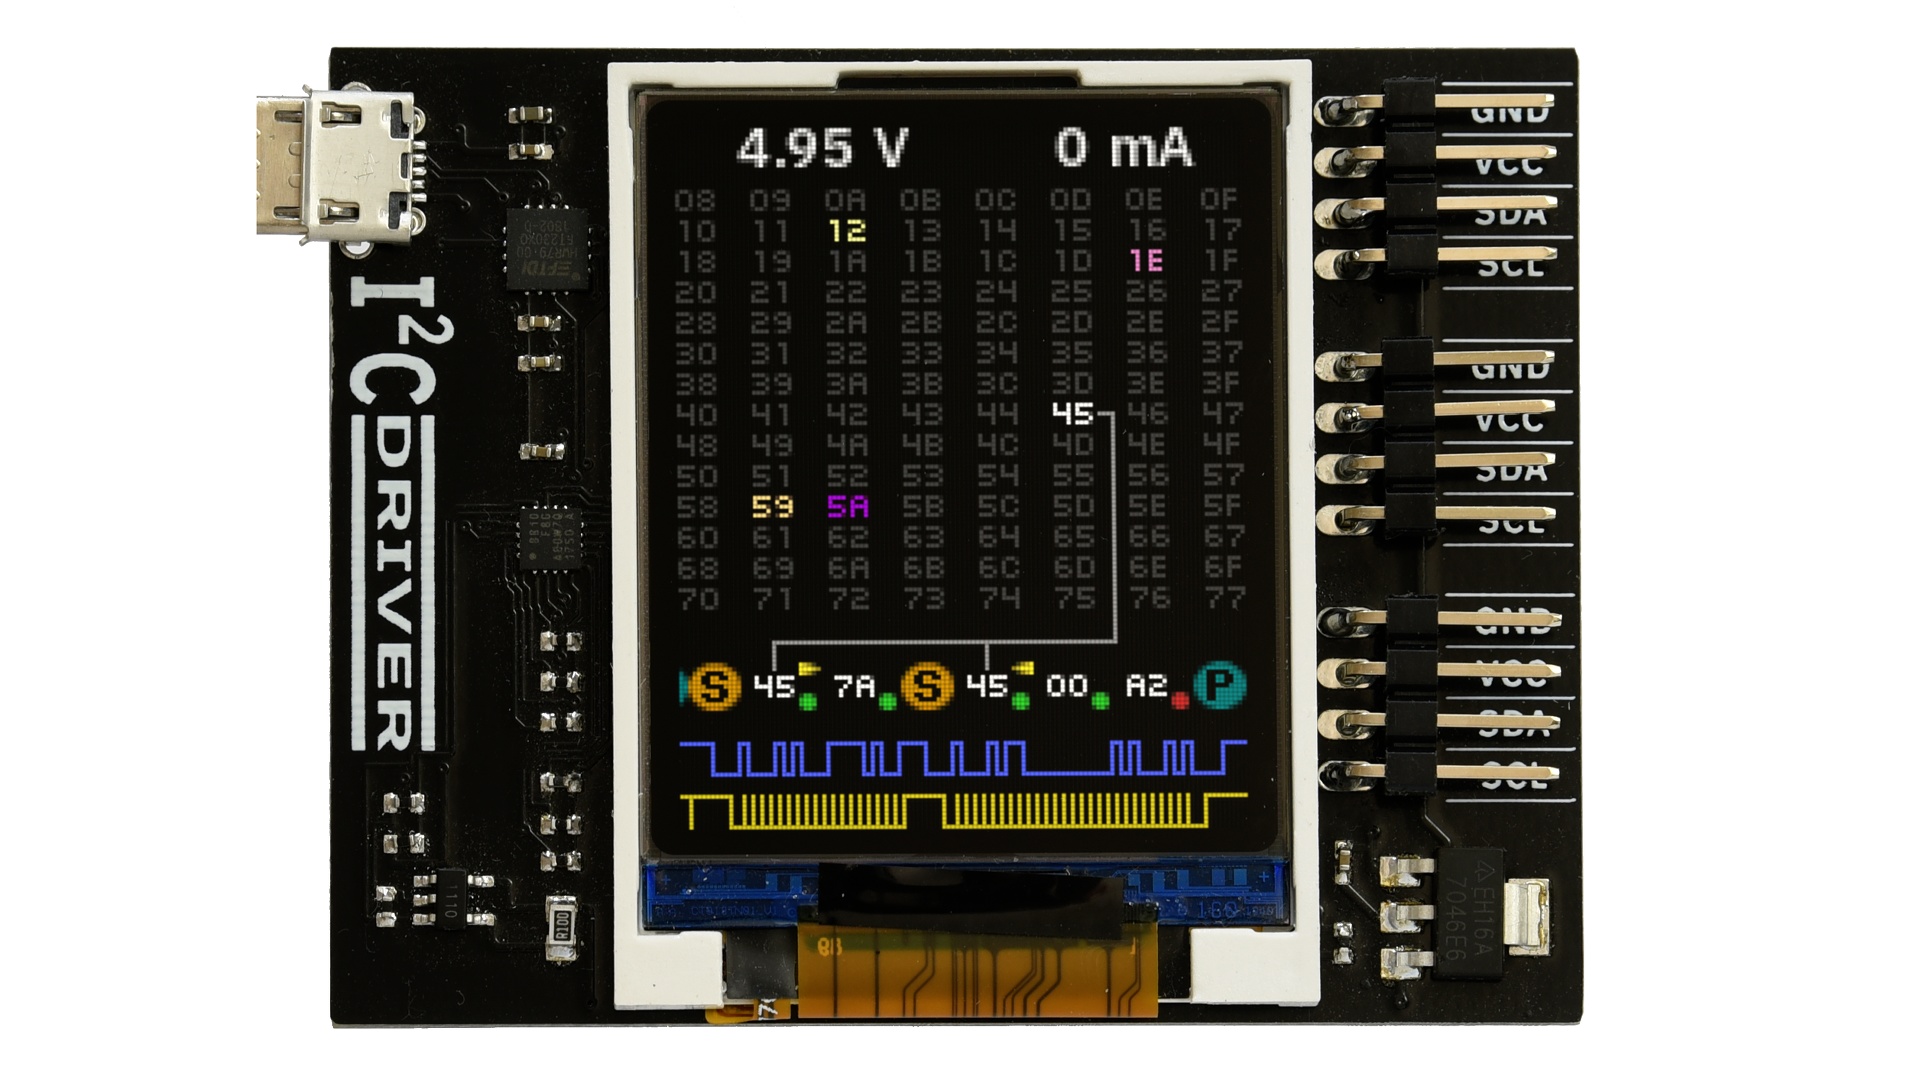 bare board, with visualization, from the i2cdriver repo
It’s a swiss army knife for I²C protocol that not only has a nice screen, but also connects via USB to your PC. It comes with reasonable documentation, nice Python API, and some samples using the API.
The original capture.py sample script allows you to capture traffic (and
also dump it into csv for later), but the console output is sub-optimal for
quick orientation in longer traces:
$ PYTHONPATH=.. python capture.py /dev/ttyUSB0

Now capturing traffic to
    standard output (human-readable)
    log.csv
Hit CTRL-C to leave capture mode
[...]
<START 0x51 WRITE ACK>
<WRITE 0x00 ACK>
<WRITE 0xf4 ACK>
<STOP>
<START 0x51 READ ACK>
<READ 0x83 ACK>
<READ 0x70 ACK>
<READ 0xf9 ACK>
<READ 0x22 ACK>
<READ 0x90 ACK>
<READ 0xe6 ACK>
<READ 0x82 ACK>
<READ 0xe0 ACK>
<READ 0x44 ACK>
<READ 0xc0 ACK>
<READ 0xf0 ACK>
<READ 0x90 NACK>
<STOP>
The csv is nice, though:
$ tail -n 18 log.csv
START,WRITE,81,ACK
BYTE,WRITE,0,ACK
BYTE,WRITE,244,ACK
STOP,,,
START,READ,81,ACK
BYTE,READ,131,ACK
BYTE,READ,112,ACK
BYTE,READ,249,ACK
BYTE,READ,34,ACK
BYTE,READ,144,ACK
BYTE,READ,230,ACK
BYTE,READ,130,ACK
BYTE,READ,224,ACK
BYTE,READ,68,ACK
BYTE,READ,192,ACK
BYTE,READ,240,ACK
BYTE,READ,144,NACK
STOP,,,
So a few minutes of work later and looksie:
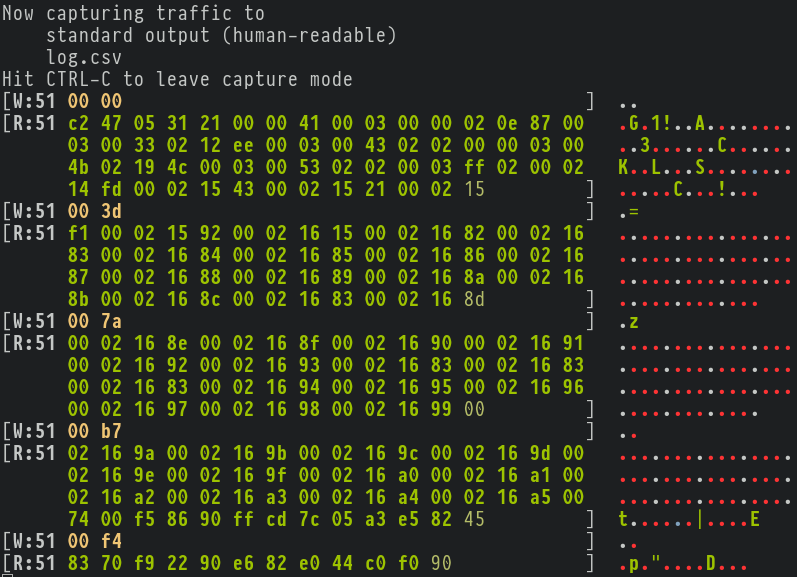 better capture for i2cdriver
and it properly flags ACKs/NACKs (non-bold for R/W, red for address NACK and/or missing stop), and the whole shebang:
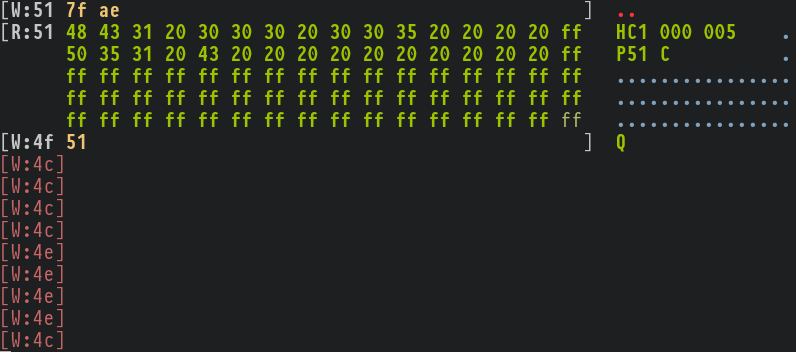 better capture for i2cdriver (capturing NACKs due to dev not present)
And when I have that, it would be a shame not to have the same support
for the csv replay, so there’s also log-replay.py that leverages the
capture.py to visualize the same way:
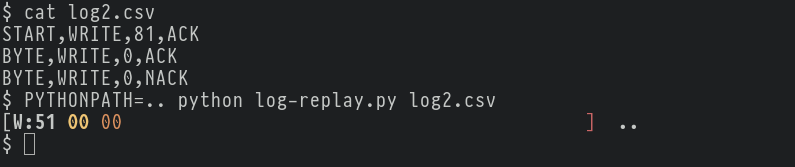 log replay: write with one ACK, one NACK and final STOP missing
It’s available in my fork of the i2cdriver repo4 and you can run it the way I am (without any package installs):
$ cd python3/samples
$ PYTHONPATH=.. python capture.py
Usage: capture.py <device> [speed]
$ PYTHONPATH=.. python capture.py /dev/ttyUSB0 400
[...]
$ PYTHONPATH=.. python log-replay.py log2.csv
[...]
Closing words
I think this is, hands down, the best 10 minute-ish I invested into my I²C debug workflow.
And it’s almost ridiculous how the Unix principles:
- Do one thing, and do it well
- Compose programs together
- Use text as a universal interface
nicely carry over to the interface between hardware and software.
-
Pictured in the Reversing the Yamaha YAS-207 infrared remote protocol, in case you wonder. ↩
-
And before you come commenting about
sigrok-cli, I couldn’t find a way to make it work in continuous mode withfx2lafw. Maybe fancier LA would be more amenable to this. ↩ -
In case you don’t want to spend the $30, I think you could – without guarantee – use i2cdriver-pico to DIY it. ↩
-
PR for it is the next step (edited: done). But would be nice to have some screenshots. Say, in the form of this blog post. ;) ↩