Succeeding at a network loadtest
Problem statement
As mentioned in the Failing at a network loadtest (for now) post, I want to test packet forwarding performance diffrence between ERLite-3, ER-4, apu2 (w/ debian), and apu2 (w/ danos).
Unfortunately in the last post I also discovered:
So it seems that APU2, while otherwise a magnificent machine, is not well suited for a proper source/sink for the network test.
The questions for today’s post are:
- Can I do better?
- How should the final loadtesting solution look like?
A new setup – works
In the last post I mentioned that I bought an Intel NIC on Amazon(.de) Marketplace for 39€ (delivered).
Sadly, the DPD courier seems to be taking the package through another galaxy. In other words, it’s still not here (after 2+ weeks).
So being the cheap ass ^W^W frugal person I am, I bought a different card, a dual port Intel I350 NIC from Ricardo.ch1. This time for 49 CHF (with pickup in person).
And it’s a beauty. Checking DPDK doc site, this NIC is fully supported by DPDK, thus by T-Rex. Yay.
Time to check the loopback test works in the new setup.
So, again, I went through the moves:
- Install t-rex to
/opt/trex-v2.89, with a symlink to/opt/trex lspcito figure out the device idsip linkto figure out the MACs- Write up a suitable
/etc/trex_cfg.yaml2
Lo and behold, after running ./t-rex-64 -i in one terminal, ./trex-console in
another, and going straight for the kill:
tui> start -f stl/udp_1pkt_simple_bdir.py -m 100%
I’m getting a fabulous result of:
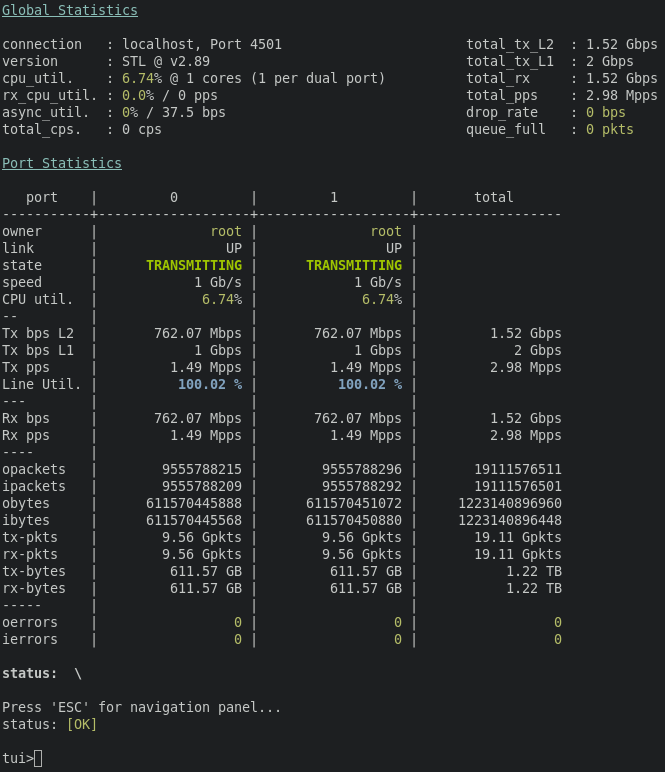
Which means that my desktop – with the dual-port I350 Intel NIC – can forward
a linerate (1Gbps) of 64B packets in both directions simultaneously. And all
that at ~7% CPU load (single core of my i7-4790K).
In other words, it’s not even breaking a sweat.
But as exciting as that result is, it’s of limited value if things were to go pear shaped with some of the devices I want to stress test3.
Proper loadtest
While I was waiting for the NIC to come, I briefly spoke with Pim (author of the loadtest post that got me inspired) about what I’m trying to accomplish.
Turns out, he was one step ahead of me, and already put together an automated loadtesting script that drives T-Rex and spits out json with the loadtest stats.
The idea behind the loadtest driver is as follows (I’m quoting verbatim from Pim’s trex-loadtest.py):
# Given a server structure and an input dictionary:
# args['profile_file']    = "udp_1pkt.py"     # Profile to use (eg. "udp_1pkt.py")
# args['output_file']     = "-"               # File to write results to, '-' for stdout
# args['warmup_mult']     = "1kpps"           # Warm up at <> multiplier (eg. "1kpps")
# args['warmup_duration'] = 1                 # Warm up for <> seconds (eg. 30)
# args['rampup_target']   = 20                # Ramp up to <> % of line rate (eg. 100)
# args['rampup_duration'] = 30                # Ramp up to target in <> seconds (eg. 180)
# args['hold_duration']   = 10                # Hold at target for <> seconds (eg. 30)
#
# Using an STL profile given in <profile_file>, this loadtest will start a
# loadtest at <warmup_mult> for <warmup_duration> seconds, after which a
# <rampup_target> (which is a percentage of line rate) is linearly achieved
# during <rampup_duration> seconds of runtime. When the target is reached, it
# is held there for <hold_duration> seconds, after which the loadtest traffic
# is stopped.
#
# Every second, stats are grabbed and added to an array. That array is written
# to a file named <output_file> when the loadtest is finished.
#
# Several invariants are held, in particular packet input/output error rates
# and loadtester CPU and queue load are measured. When they are out of bounds,
# the loadtest is aborted.
In order to use the loadtester, I had to configure it:
# stl_path.py
import sys
sys.path.append('/opt/trex/automation/trex_control_plane/interactive')
STL_PROFILES_PATH = '/opt/trex/stl'
After that, running:
$ python3 trex-loadtest.py --output loopback-imix.json
Running against 127.0.0.1 profile imix.py, warmup 1kpps for 30s, rampup target 100% \
  of linerate in 600s, hold for 30s output goes to loopback-imix.json
Mapped ports to sides [0] <--> [1]
Warming up [0] <--> [1] at rate of 1kpps for 30 seconds
Setting load [0] <--> [1] to 1% of linerate
stats:     3.19 Kpps     9.95 Mbps (1.00% of linerate)
stats:     4.87 Kpps    14.98 Mbps (1.50% of linerate)
[...]
stats:     6.53 Kpps    19.94 Mbps (1.99% of linerate)
Setting load [0] <--> [1] to 2% of linerate
stats:     9.83 Kpps    30.02 Mbps (3.00% of linerate)
stats:    11.49 Kpps    35.09 Mbps (3.51% of linerate)
stats:    12.25 Kpps    37.41 Mbps (3.74% of linerate)
[...]
stats:   648.55 Kpps     1.98 Gbps (198.11% of linerate)
stats:   649.75 Kpps     1.98 Gbps (198.48% of linerate)
stats:   647.12 Kpps     1.98 Gbps (197.67% of linerate)
Setting load [0] <--> [1] to 100% of linerate
Holding load [0] <--> [1] at 100% of linerate for 30 seconds
stats:   649.21 Kpps     1.98 Gbps (198.31% of linerate)
stats:   653.37 Kpps     2.00 Gbps (199.58% of linerate)
stats:   655.42 Kpps     2.00 Gbps (200.21% of linerate)
stats:   652.96 Kpps     1.99 Gbps (199.46% of linerate)
stats:   655.16 Kpps     2.00 Gbps (200.13% of linerate)
[...]
stats:   655.83 Kpps     2.00 Gbps (200.33% of linerate)
stats:   653.45 Kpps     2.00 Gbps (199.61% of linerate)
Loadtest finished, stopping

Test has passed :-)

Writing output to loopback-imix.json
gives me nicely formatted loopback-imix.json.
To which, you could say – what’s the use of having a bunch of stats in a json file, if I can’t make much sense of it? Yeah. Precisely.
Visualizer
Because Pim already ran bunch of loadtests on his gear, he supplied me with
bunch of his *.json output files (and a high level description of how the
loadtest should look like), and I got to work writing a visualizer script.
To cut the story short, trex-loadtest-viz is that visualizer.
Btw, at first I was using gnuplot to plot the curves, but soon it became apparent4 that not having an interactive graph would be a loss. So I switched to C3.js library5. Thus gaining interactivity, and pushing some of the computation to the client side.
The results are pretty spiffy graphs:
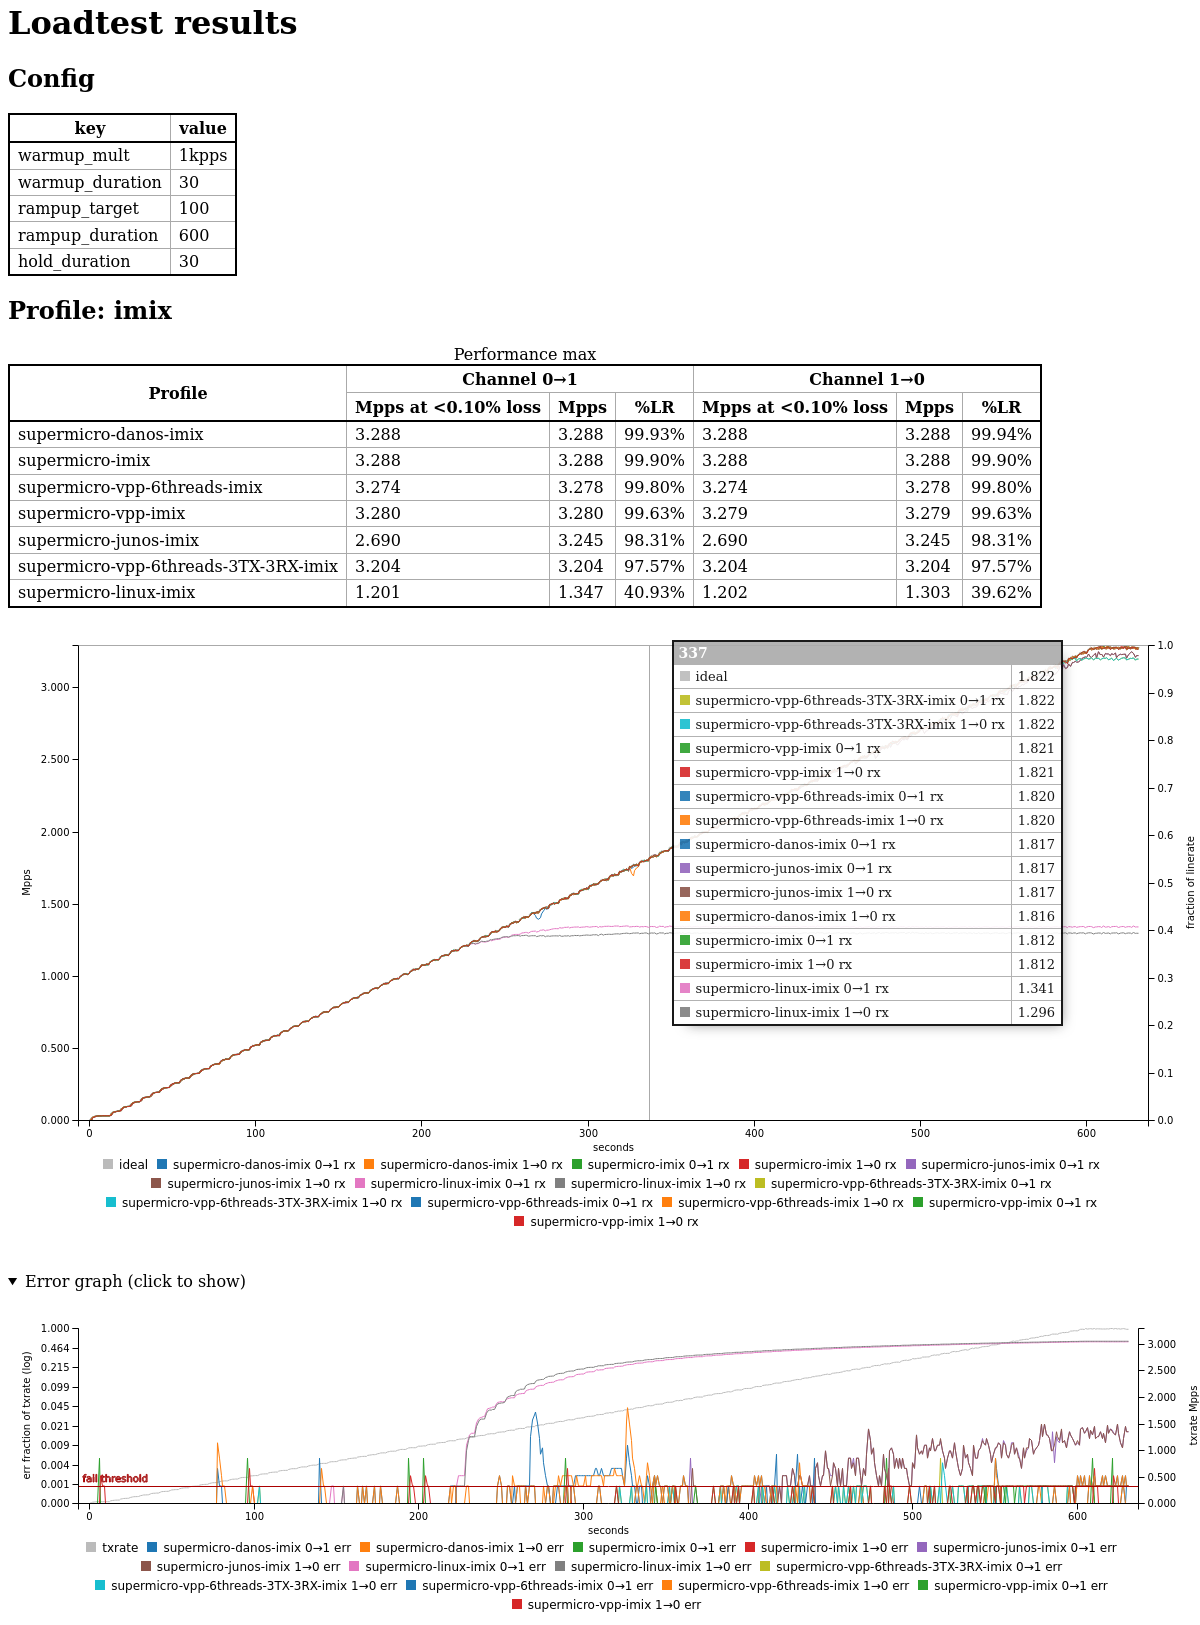 output graph screenshot (with a mouse in the middle of the first graph); click to enlarge
But to give you the first hand experience of this goodness, I ran one more test:
$ python3 trex-loadtest.py --profile udp_1pkt_simple_bdir.py \
  --output loopback-64B.json
got the loopback-64B.json, and then graphed the result using:
$ ruby ~/trex-loadtest-viz/graph.rb *.json && mv index.html result.html
See the output for yourself.
Granted, it’s not as exciting as the multiple DUTs on the screenshot above, but more exciting graph will come in the next installment. :-)
Closing words
Having the setup for the loadtest ironed out, in the next installment I will take all these bad boys for a spin:
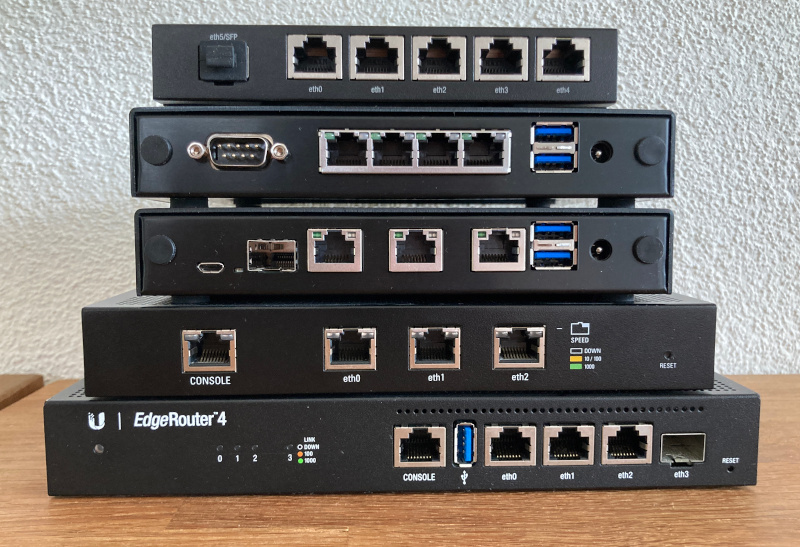
From top to bottom:
- Ubiquiti – EdgeRouter X
- PC Engines – apu4d4
- PC Engines – apu6b26
- Ubiquiti – EdgeRouter 3 Lite
- Ubiquiti – EdgeRouter 4
On the APUs I plan to compare vanilla linux distro and Danos. On the Ubiquiti gear, it will be tested running the stock firmware.
Stay tuned.
-
Last I checked, they still had some. But you have to search for
1350-t2orRicX4520. It’s a HP network card, but it’s a genuine I350-t2, made in Taiwan. ↩ -
See the previous post for deets. I managed to mess up the MACs initially (flipping
dest_macandsrc_macon one of the ports), result of which was that I had 100% packet loss on one of the channels, and 0% loss on the other. ↩ -
And things will go pear shaped, I can guarantee that. But you’ll have to wait for the next installment for the gory details. ↩
-
Or you could say that the internal tools at work spoiled me beyond any measure. ↩
-
a pre-prod version of apu6b4 with the only diff that it has 2GB RAM, not 4GB. ↩